Views: 992
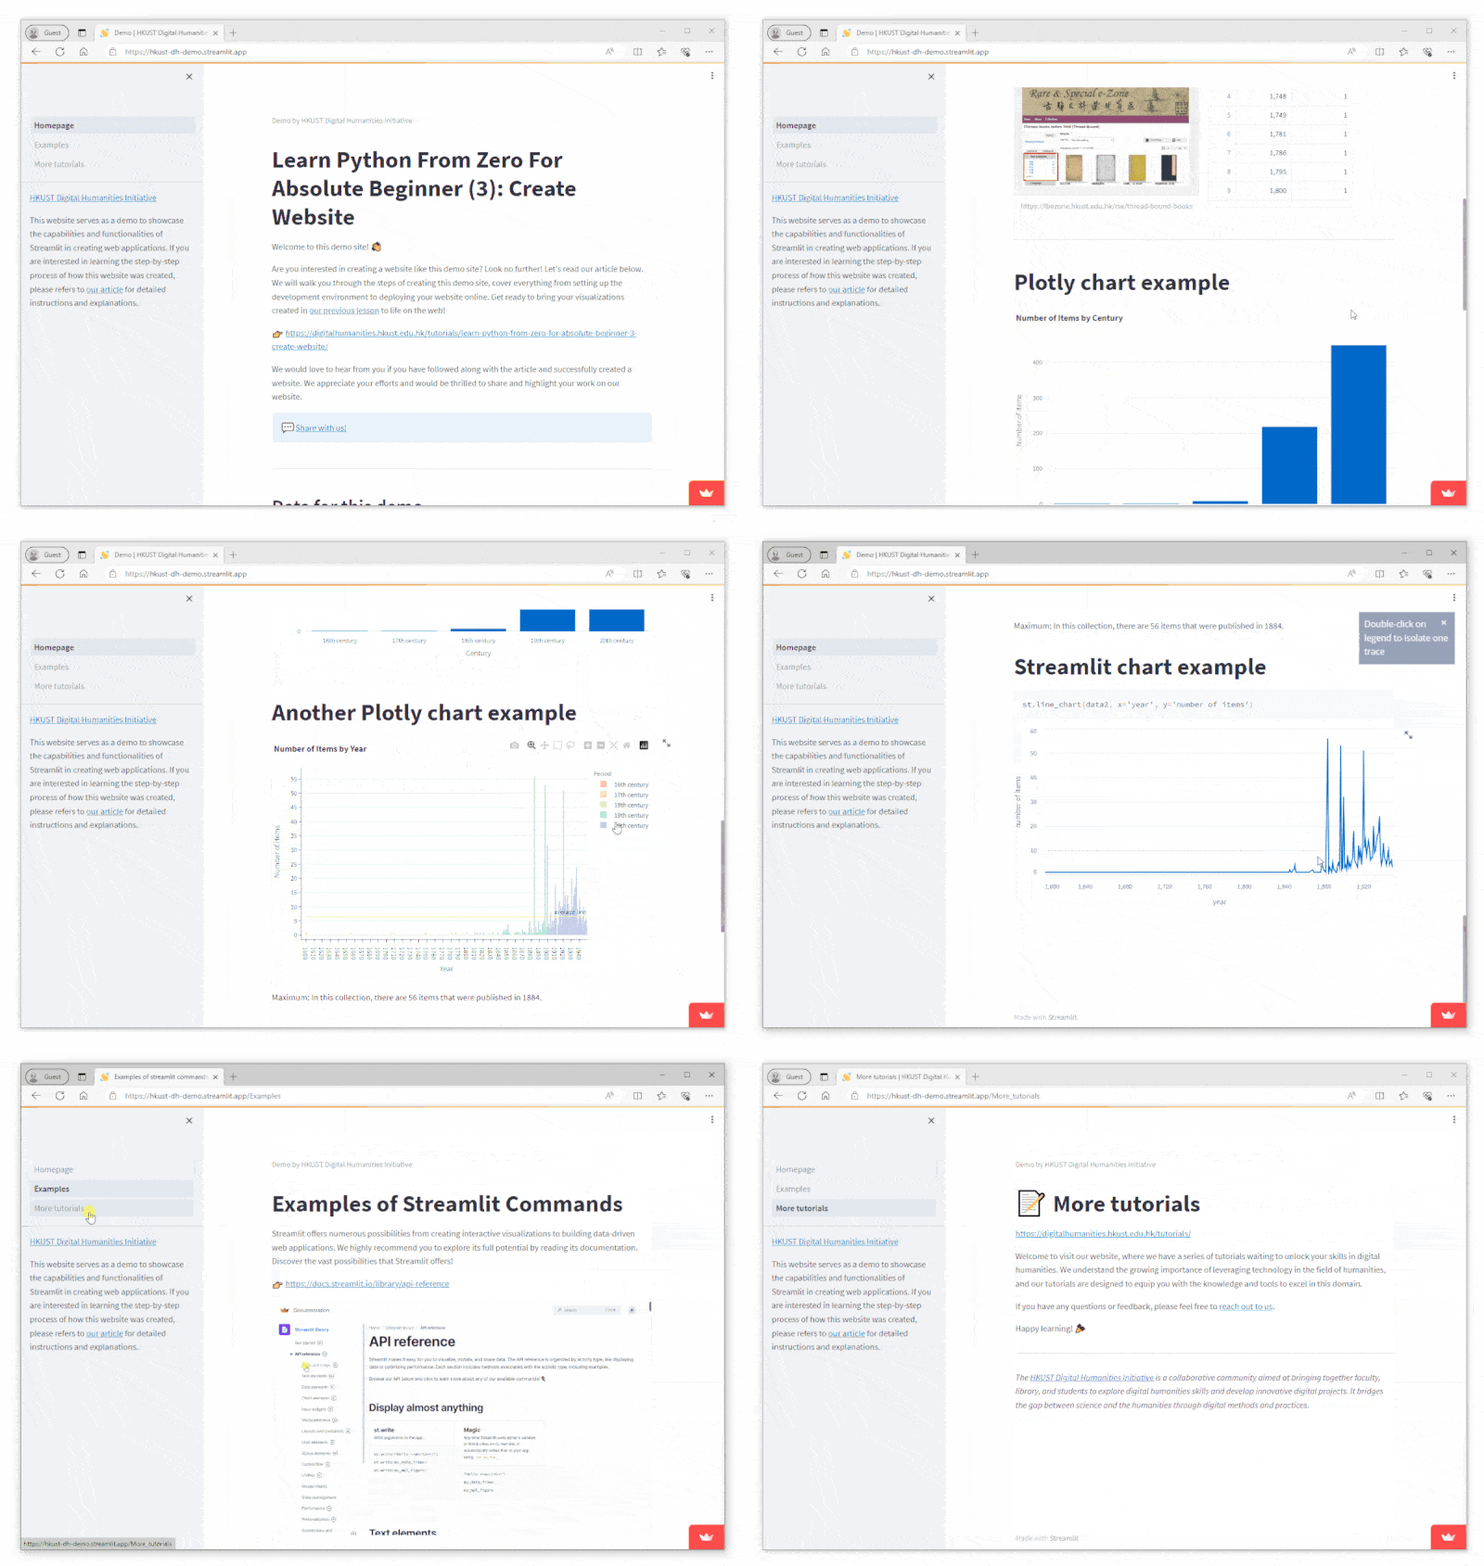
Welcome to the final article of our “Learn Python From Zero For Absolute Beginner” series! We would like to express our gratitude to all of you who have followed along with us on this learning journey. We believe that you are now able to use Python to perform data manipulation tasks, create interactive visualizations, and build your very own websites.
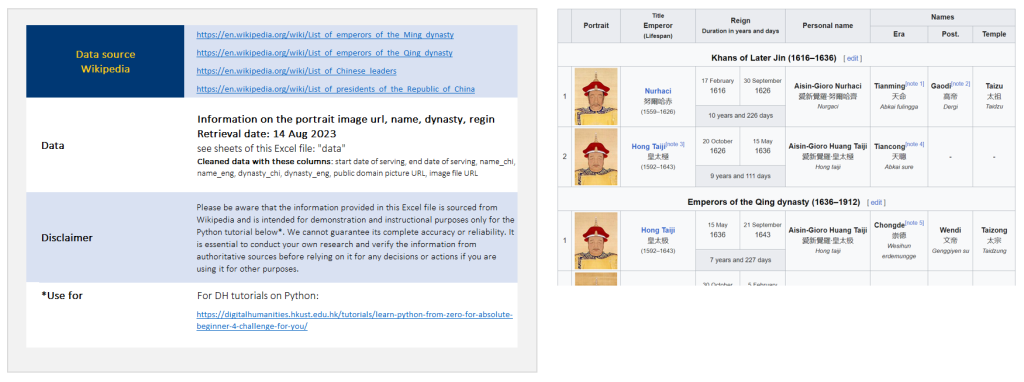
To challenge your newfound skills, we have prepared an exciting task for you. We have gathered a dataset containing information about the serving periods of different leaders during 1572-1949. You can download this dataset from our GitHub repository.

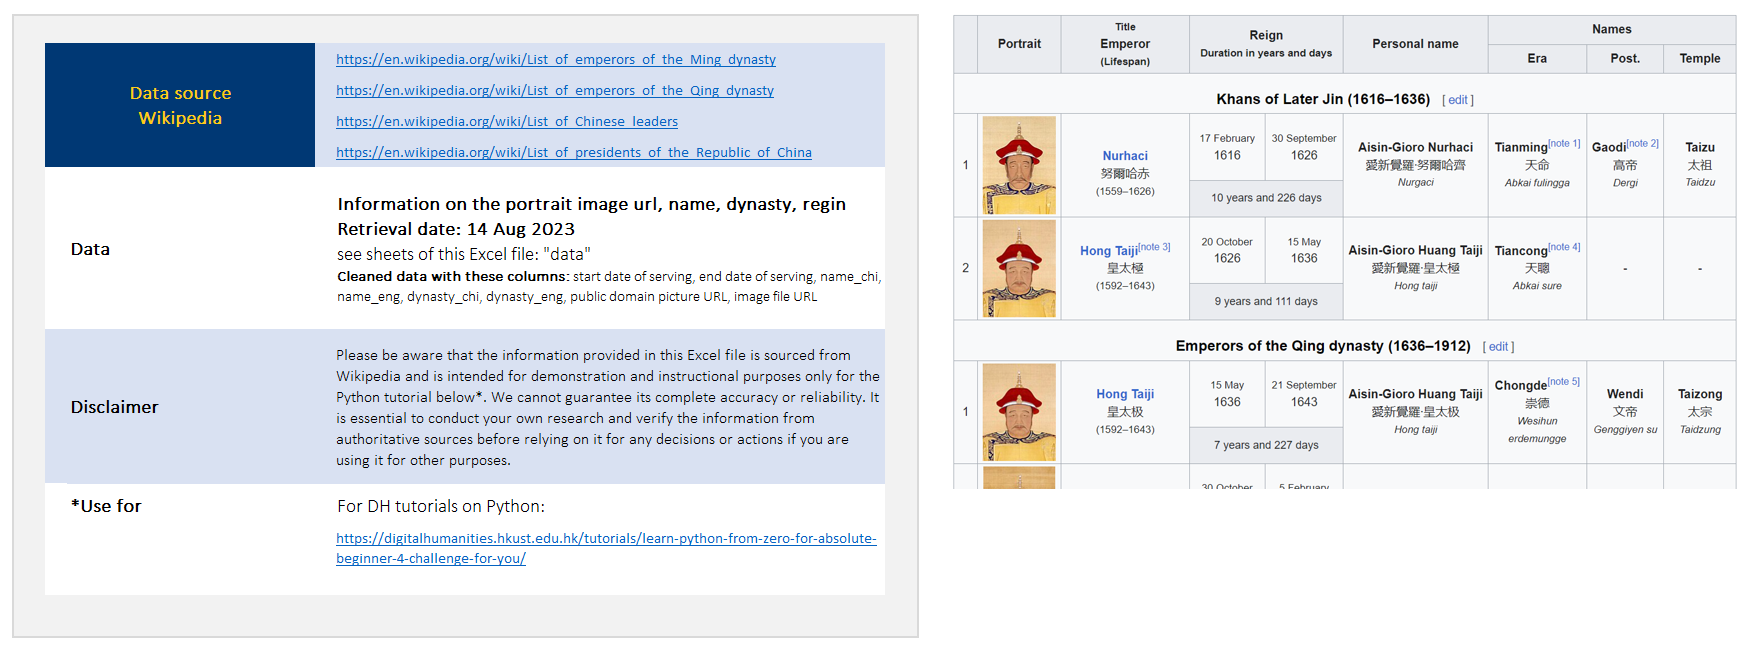
Download this dataset here
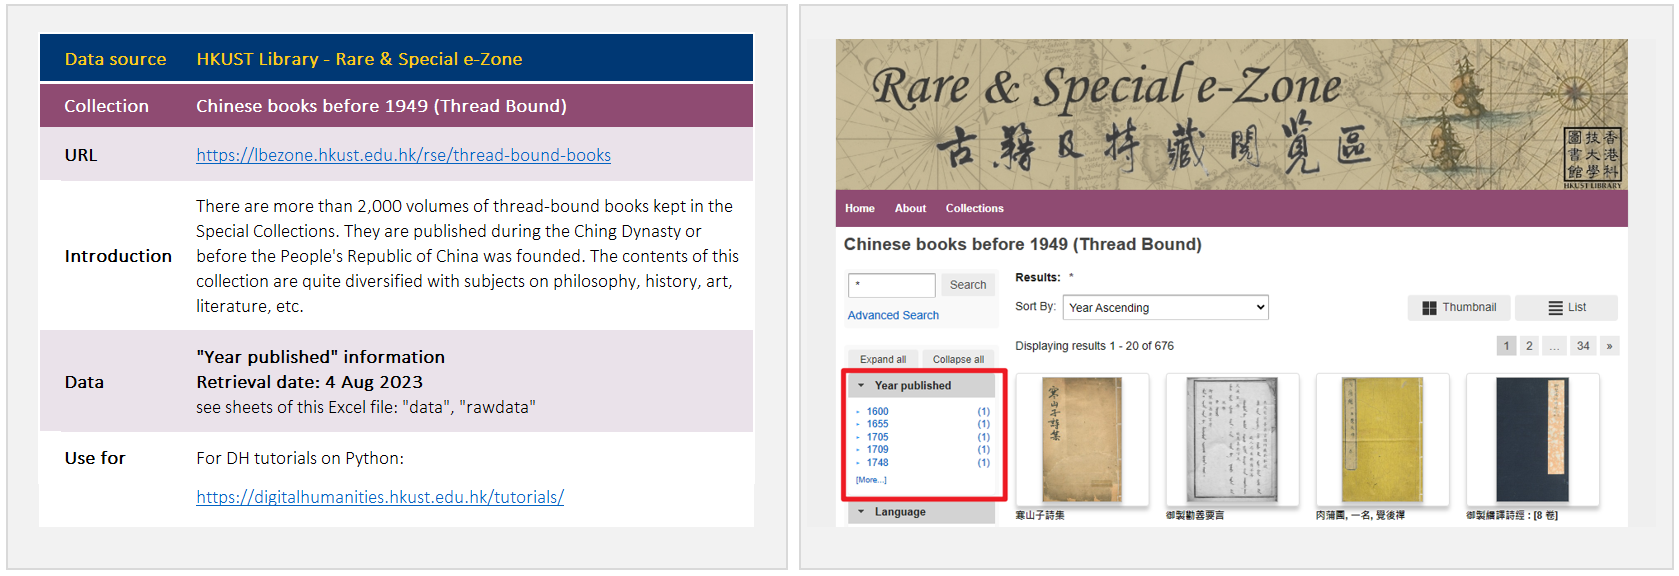
Download this dataset here
Now, it’s time to put your skills to the test and make use of this additional data to create compelling visualizations that can be showcased on your website. Here are a few ideas to get you started, but feel free to brainstorm and explore other possibilities as well:
- Thread Bound Book Analysis: Explore the collection of thread bound books in our dataset and identify the periods when they were most prevalent. Are there any interesting patterns or trends that emerge? Create visualizations that highlight the relationship between thread bound books and specific leaders or emperors.
- Dynamic Timeline: Build an interactive timeline that showcases the serving periods of different leaders and show their portrait.
- Leader Comparison: Select a few prominent leaders from the dataset and create a comparative visualization that highlights the duration of their respective reigns. This could be in the form of a bar chart or a line graph, showcasing the different lengths of their periods in power.
Share with us!
We encourage you to take up this challenge and leverage the additional dataset to create captivating visualizations. If you build a website featuring your work, please share it with us. We would be thrilled to feature your website on our platform, allowing more people to appreciate your creative visualizations.
Thank you once again for joining us on this Python tutorial series. We hope this final article inspires you to continue exploring and applying your newfound skills in your future endeavors. Happy coding and visualization!
– By Holly Chan, Library
October 5, 2023

