Views: 2,948
In our previous article, we dived into the world of data visualization using Python and equipped you with the skills to create various charts and graphs. Now, in this article, we are excited to take your visualization journey a step further by showing you how to build a website using Python.
By following our step-by-step guide, you will learn how to leverage Python, along with tools like Streamlit and GitHub, to create an interactive website. We will cover everything from setting up the development environment to deploying your website online. Get ready to bring your visualizations to life on the web and share them with others!
By the end of this article, you will be able to create a website like the screenshot below – a multi-pages website that can display the interactive Plotly charts you created in the previous lesson.
Our demo site: https://hkust-dh-demo.streamlit.app/
What you will learn in this article
- Python Libraries “streamlit”
- Create website using Python
- Create repository and upload files to Github
- Publish your website online
Introduction to Streamlit
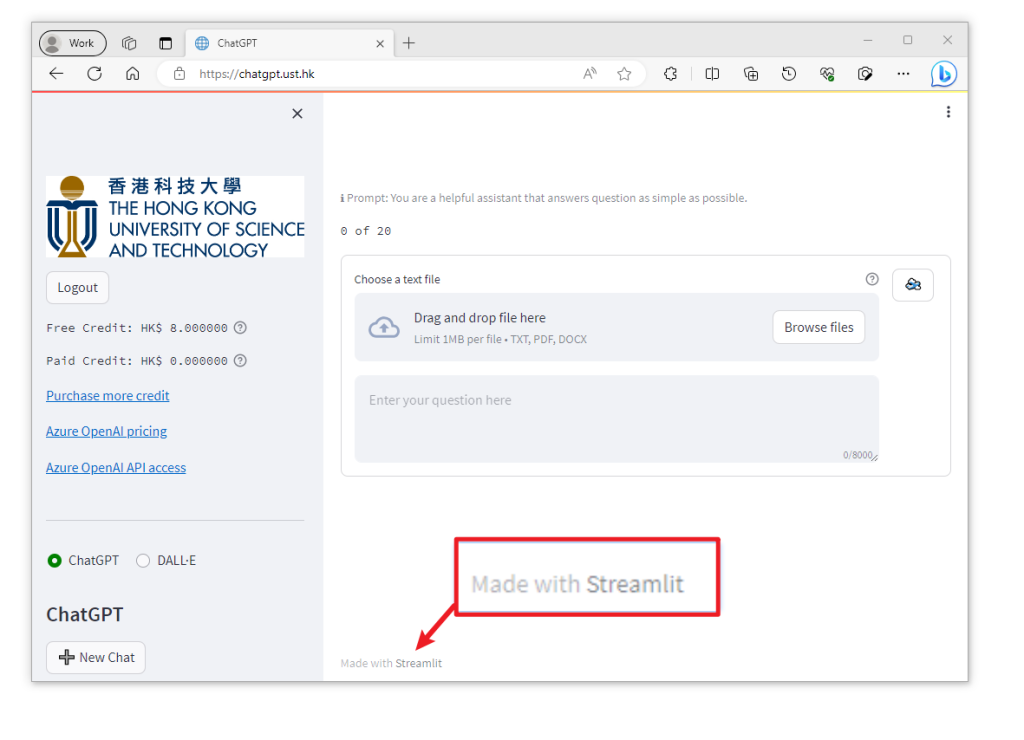
Streamlit is an open-source app framework and python library, allowing people to create web apps in minutes. It is a popular choice for developing web applications in the field of machine learning and data science. For example, the HKUST ChatGPT is made with Streamlit too!
Source files
While we have released the entire source code of this demo site on our Github repository, we encourage you to follow along with us to create each file from scratch.
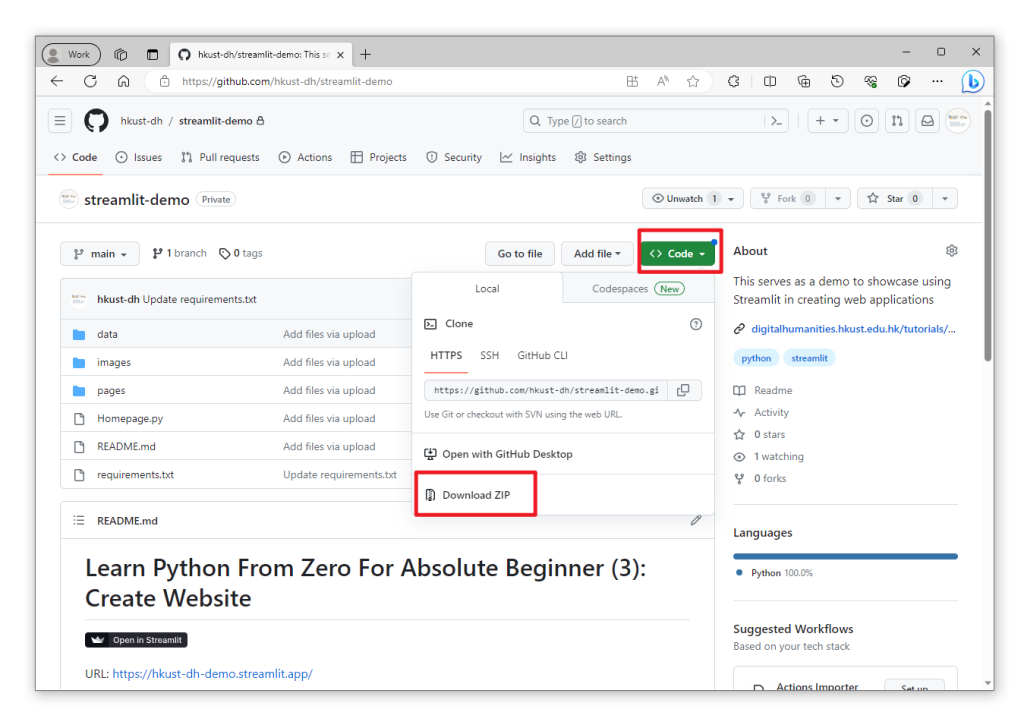
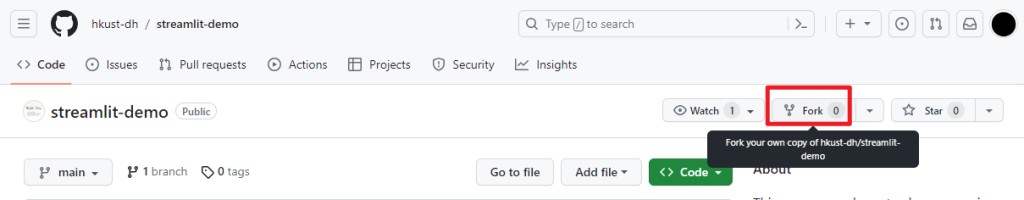
Alternatively, you may also fork our repository.
In the context of GitHub, “fork” refers to creating a personal copy of a repository (a collection of files and folders) hosted by another user. When you fork a repository, you create an independent copy of the original repository under your own GitHub account. This copy allows you to freely experiment, make changes, and contribute to the project without affecting the original repository.
File structure
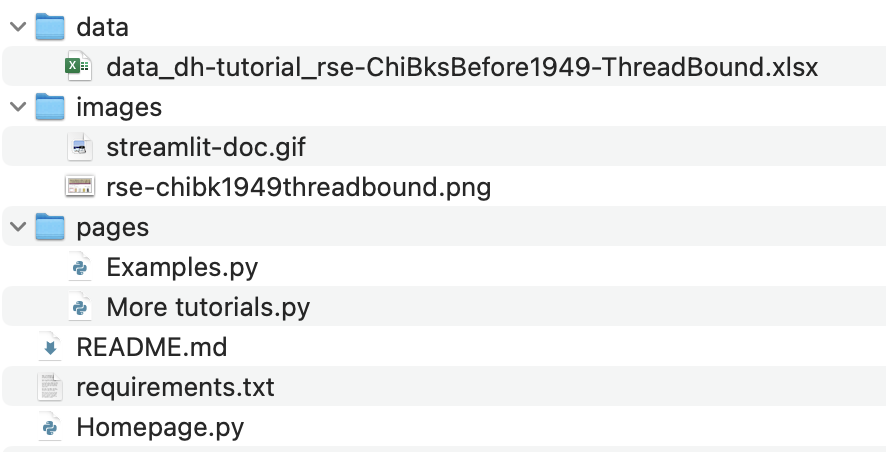
| Common file structure for a streamlit app | |
|---|---|
| Folder | Files |
| root | Homepage (.py file)requirements.txt |
| pages | Other pages (.py file) |
View the website locally
Before we dive into creating webpages from scratch, let’s first see how to run a Streamlit app on your local machine. Any modifications you make to your code will be instantly reflected when you refresh the app on your localhost after executing the steps below. By doing so, you can immediately observe the results as you fine-tune your webpages.
In this tutorials, we will be using VS code as the code editor for demonstration. However, feel free to use whatever code editor suits you best.
Steps:
1. Open the project folder.
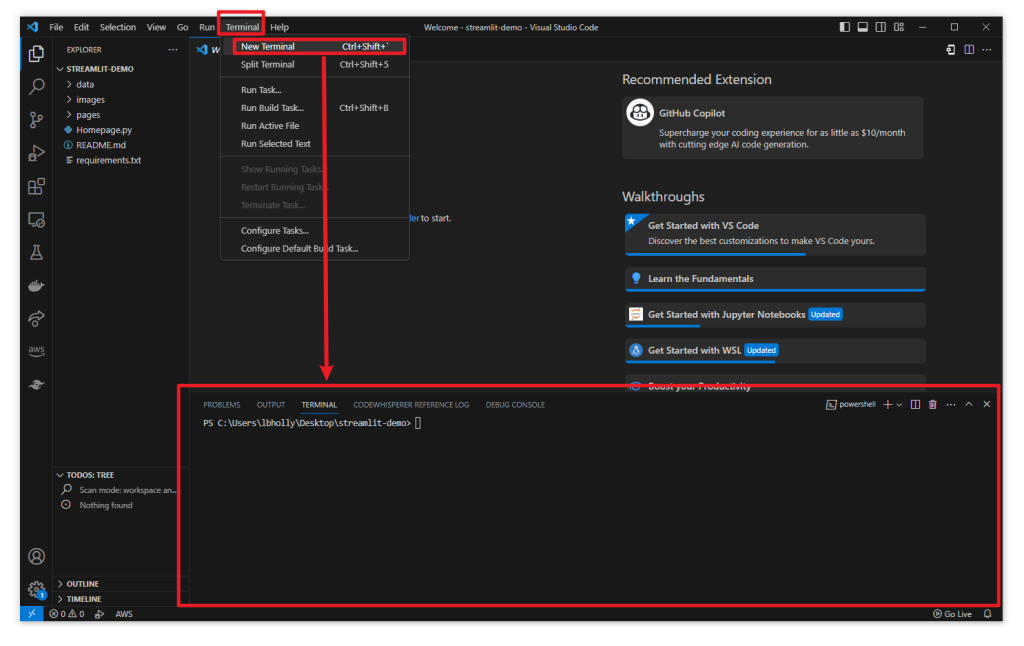
2. Open terminal by click “Terminal” → “New Terminal” in the menu bar (shortcut in VS code:
3. Ensure python and pip are installed in your computer. If not, download them to your computer.
4. Install the required dependencies or packages listed in the file
pip3 install -r requirements.txt
or
pip install -r requirements.txt
The
5. Run the Streamlit app in your local machine by typing the following commands in the terminal (see screenshot below for demo):
python -m streamlit run Homepage.py
or
streamlit run Homepage.py
6. A Local URL (e.g. http://localhost:8501/) will be shown in the terminal. You should now be able to view the website by placing the URL in your browser.
Without further ado, let’s dive straight into the process of building the website using streamlit from scratch.
Start to create website from scratch
1. Create files in your computer
First, create a new folder to store all the files that you are going to be created in this project.
1.1 Create requirements.txt
Inside the project folder, create a file named
streamlit==1.26.0
pandas==2.0.3
plotly_express==0.4.1
openpyxl
The
In this demo project, we will use the following 4 libraries:
1.2 Create Homepage
Inside the project folder, create a .py file. This will be the landing page of the our website.
In this demo project, we named it as
We would like to add some text, image and plotly charts to this page, which required the use of some python libraries. So, let’s import the libraries by typing the following lines in the file
import streamlit as st
import pandas as pd
import plotly.express as px
Then, set the page configuration by inputting the following lines inside the file:
st.set_page_config(
    page_title="Demo | HKUST Digital Humanities Initiative",
    page_icon="👋",
)Add caption and title.
st.caption("Demo by HKUST Digital Humanities Initiative")
st.title("Learn Python From Zero For Absolute Beginner (3): Create Website")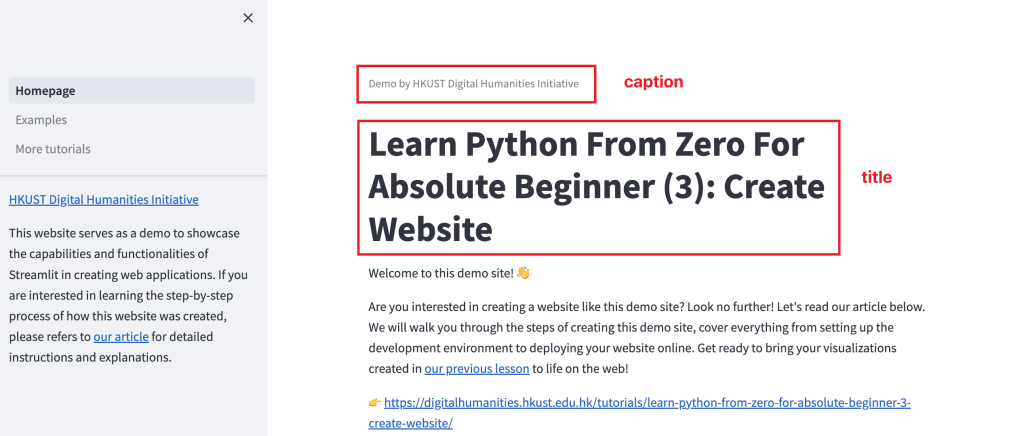
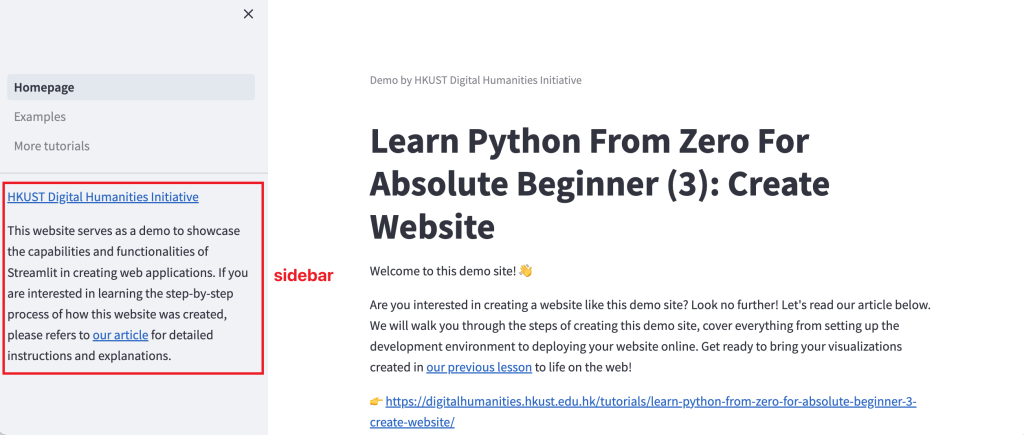
You may also add elements in the sidebar.
with st.sidebar:
    st.markdown("enter elements that you would like to show in the sidebar here")
Not familiar about Markdown syntax? You may refer to our Markdown Cheatsheet for reference!
1.3 Add interactive Plotly charts to webpage
Adding a Plotly chart to the Streamlit app is incredibly straightforward – simply copy the Python code you created in our previous article on data visualization.
# read Excel file data
filepath = 'data/data_dh-tutorial_rse-ChiBksBefore1949-ThreadBound.xlsx'
data = pd.read_excel(filepath, sheet_name='data')
# Data pre-processing
data2 = data.copy()
data2.rename(columns={'year published':'year'}, inplace=True)
data2['Period'] = ['16th century' if 1501 <= year <= 1600 else '17th century' if 1601 <= year <= 1700 else '18th century' if 1701 <= year <= 1800 else '19th century' if 1801 <= year <= 1900 else '20th century' if 1901 <= year <= 2000 else "Ungrouped" for year in data2['year']]
# create plotly chart
plotly_chart1 = px.histogram(data2, x='Period', y='number of items')
plotly_chart1.update_layout(
    title = 'Number of Items by Century',
    yaxis_title='Number of items',
    xaxis_title='Century',
)
# show the plotly chart
st.plotly_chart(plotly_chart1, use_container_width=True)
# another plotly chart
plotly_chart3 = px.bar(data2, x='year', y='number of items',
            color='Period',
            color_discrete_sequence=["#ffb7b2", "#ffdac0", "#e3f0cb", "#b5ead9", "#c7cee9"])
plotly_chart3.update_layout(
    title = 'Number of Items by Year',
    yaxis_title='Number of items',
    xaxis_title='Year',
    paper_bgcolor = 'white',
    plot_bgcolor = 'white',
    xaxis = dict(
        showline = True,
        linecolor = 'rgb(102, 102, 102)',
        tickfont_color = 'rgb(102, 102, 102)',
        showticklabels = True,
        dtick = 10,
        ticks = 'outside',
        tickcolor = 'rgb(102, 102, 102)',
    ),
    yaxis = dict(
        showline = True,
        linecolor = 'rgb(102, 102, 102)',
        tickfont_color = 'rgb(102, 102, 102)',
        showticklabels = True,
        dtick = 5,
        ticks = 'outside',
        tickcolor = 'rgb(102, 102, 102)',
    ),
)
plotly_chart3.add_hline(y = data2['number of items'].mean(), annotation_text = 'average line', line_width = 1, line_color = '#edc982')
plotly_chart3.update_layout(hovermode='x unified')
# show the plotly chart
st.plotly_chart(plotly_chart3, use_container_width=True)
The only difference is that, we wrote .py file for Streamlit application.
Another remarkable difference would be: In Jupyter Notebook, we usually use
For more details and more functions, we highly recommend you to explore the Streamlit documentation: https://docs.streamlit.io/library/api-reference
You’ll discover numerous features, tips, and tricks that can enhance your Streamlit applications!
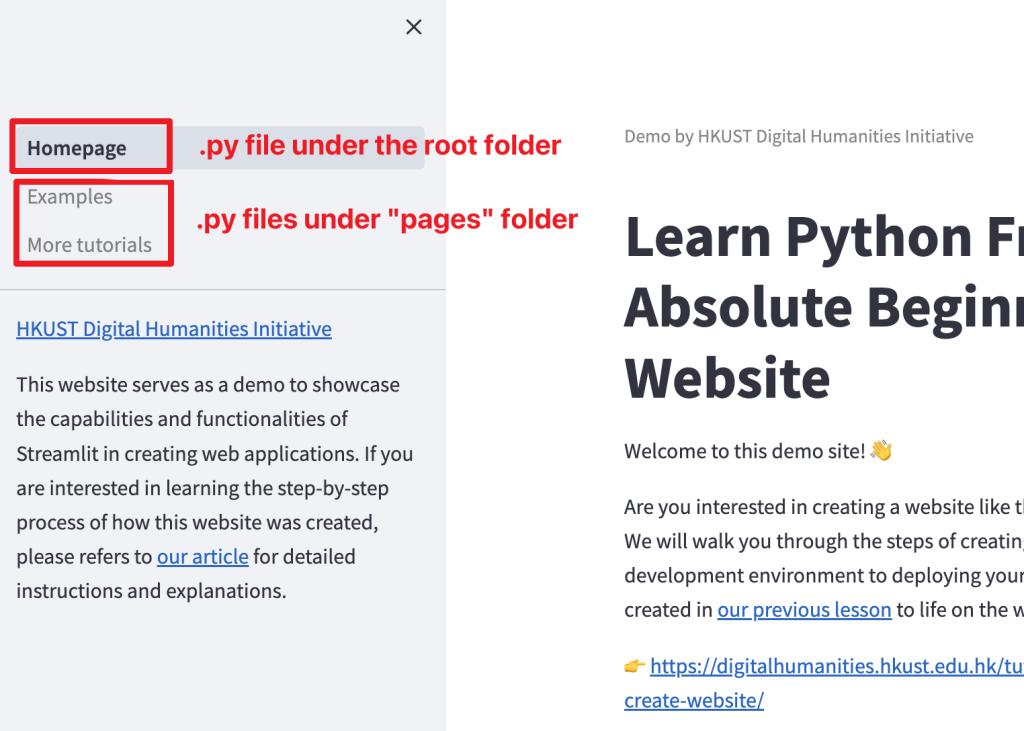
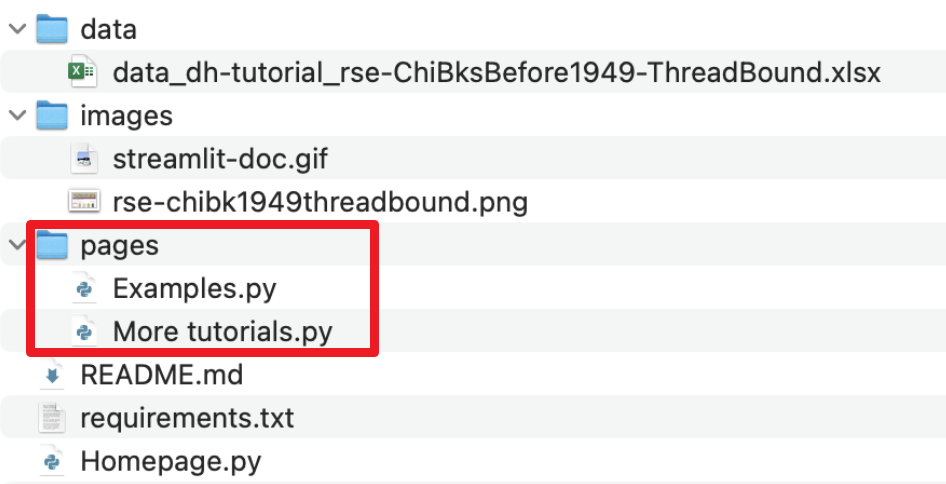
1.4 Create Other pages
Inside the project folder, create a folder named
Then create .py files inside the
For example, we would like to create a page named “Examples” and “More tutorials”. Then, create a
Normally, below are the necessary elements for a page. If you find it useful, feel free to use it as template:
###############################################################
# import python libraries
###############################################################
import streamlit as st

###############################################################
# page info
###############################################################
st.set_page_config(
    page_title="enter page title text here",
    page_icon="enter a page icon here",
)

###############################################################
# page content
###############################################################
st.caption("enter caption here")
st.title("enter title here")
Now, we believe you have successfully created several pages by following the steps above. Congratulations! It is time to take one last step before deploying your masterpiece online. To ensure everything is functioning correctly, take a moment to view the website locally once again for double-checking.
If everything is alright, let’s begin the process of taking your website from your local machine to the online world.
2. Upload files to Github
1. If you do not have a GitHub account yet, please create one before proceeding further.
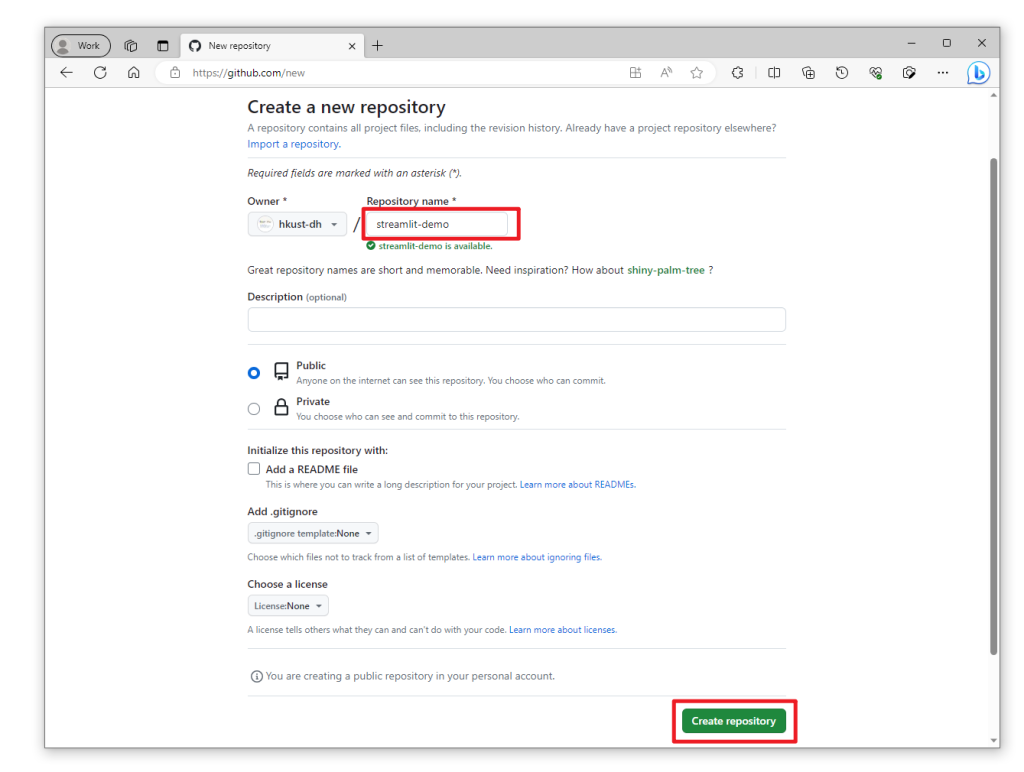
2. Create a new repository https://github.com/new (see screenshot below)
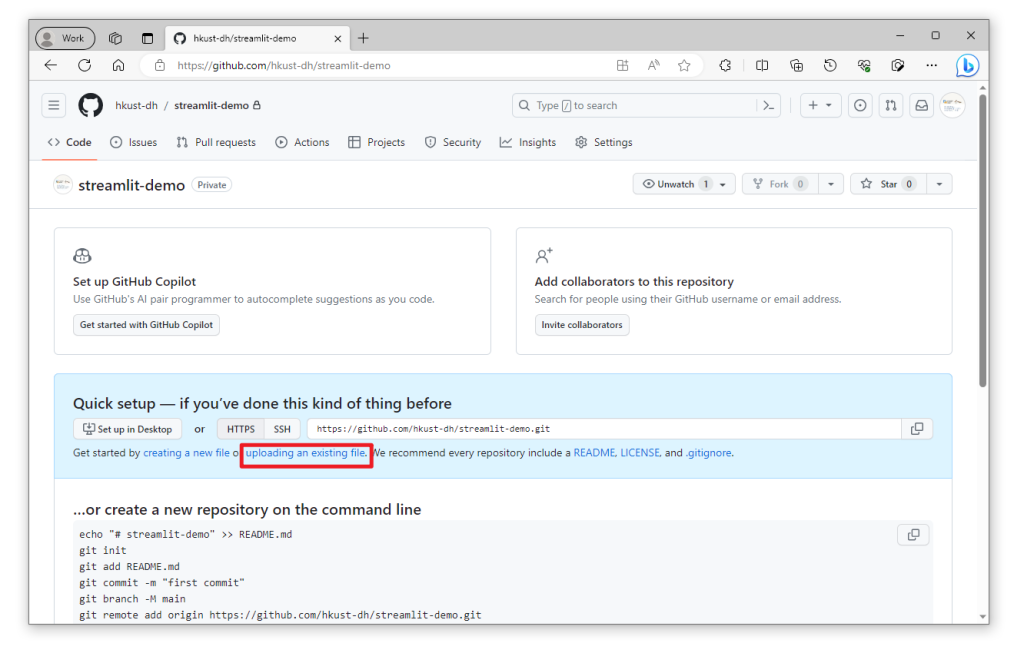
3. Upload all the files in your project folder to your Github repository.
3. Deploy the Streamlit app online
1. If you do not have a Streamlit account yet, please create one before proceeding further.
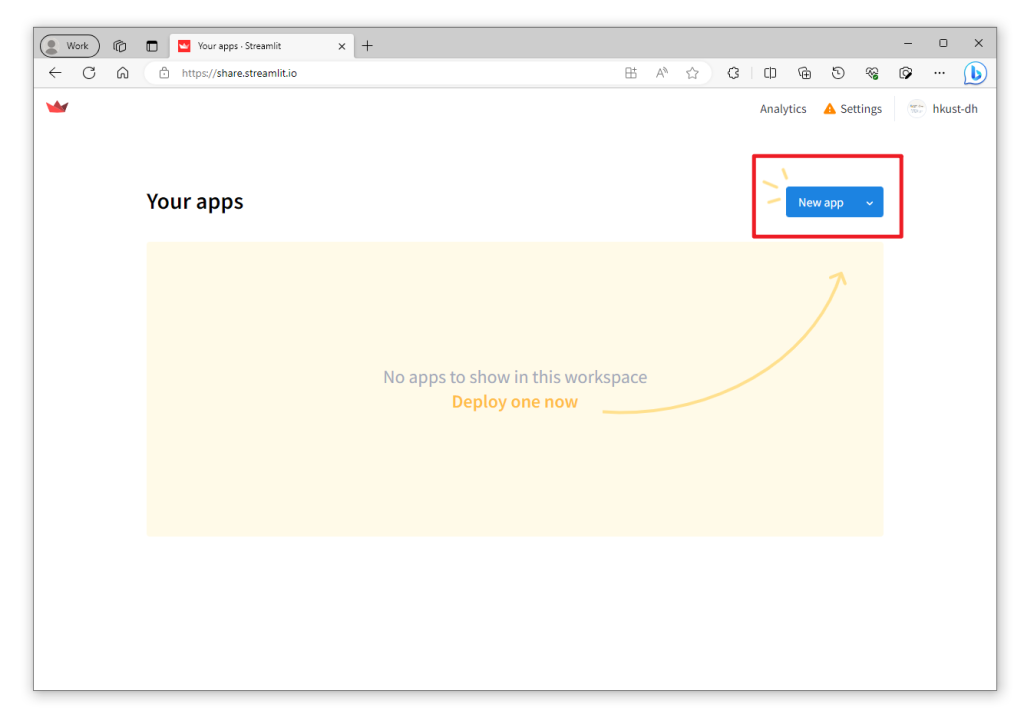
2. Go to https://share.streamlit.io/ , click the “New app” button.
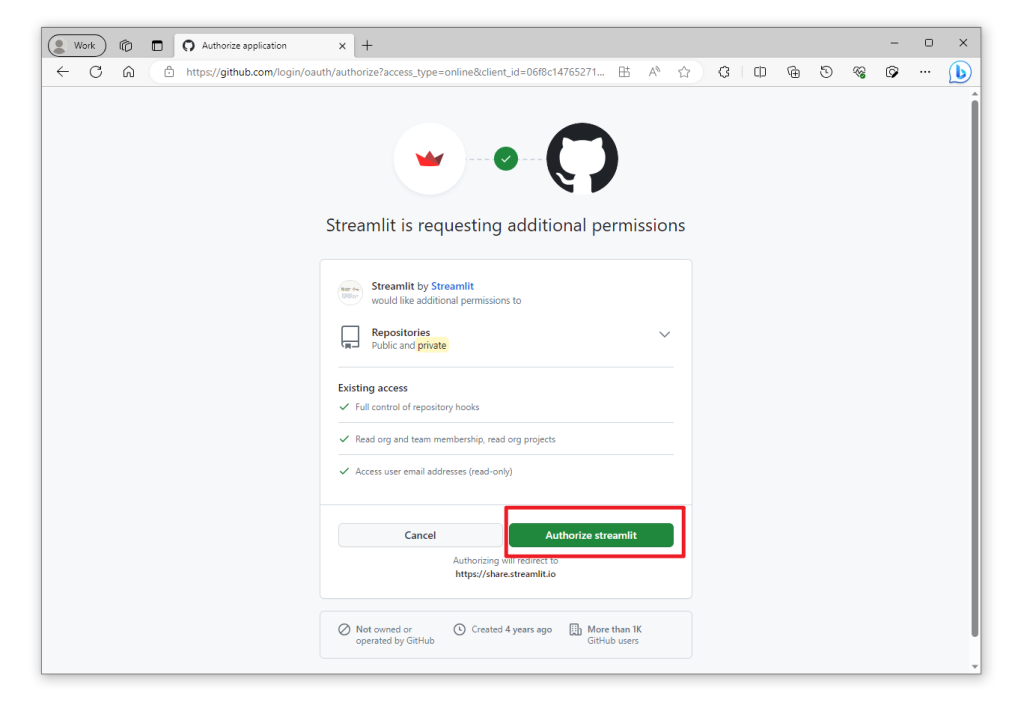
3. Authorize Streamlit to access your Github repositories.
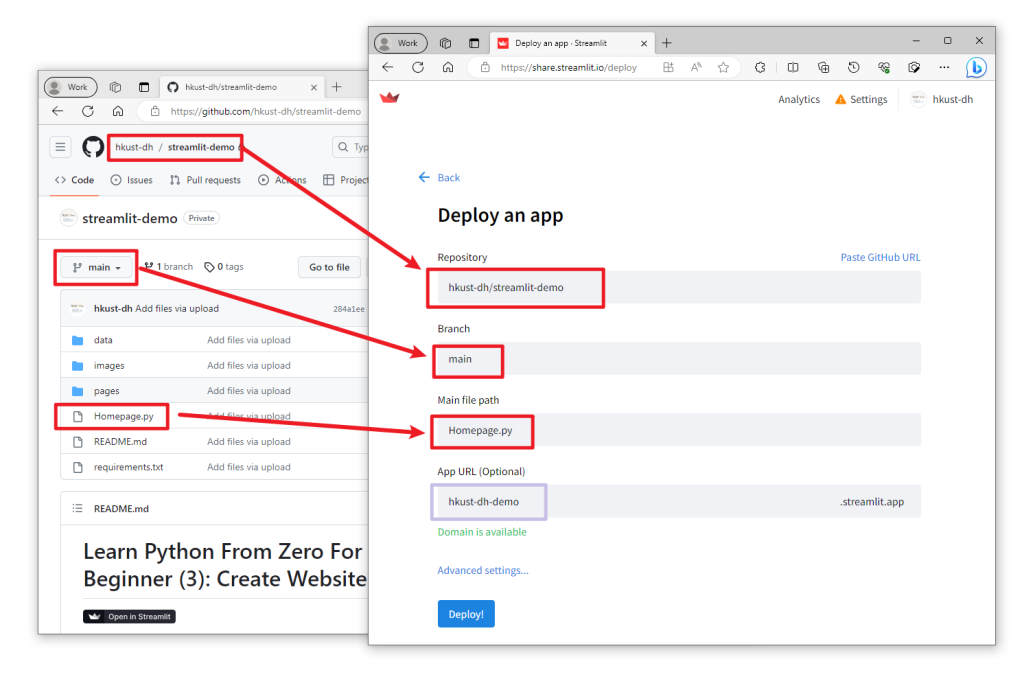
4. Select the Github repository that you just created and enter necessary information in Streamlit (see screenshot below for reference).
5. Then, you will be able to view your website by the App URL you defined just now.
6. Click “Share” on the upper-right corner and enable “Make this app public”.
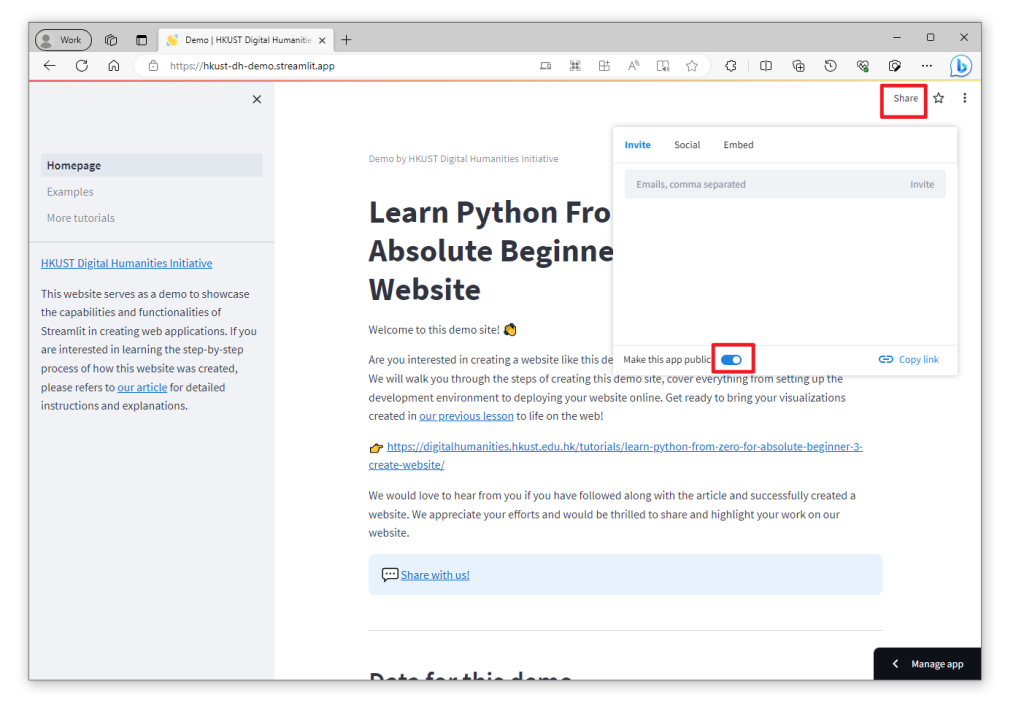
7. Congratulations! 🎉 Your website is now successfully deployed, and it is now accessible to people all around the world on the Internet.
Share with us!
We would love to hear from you if you have followed along with this article and successfully created a website. We appreciate your efforts and would be thrilled to share and highlight your work here. Share with us!
– By Holly Chan, Library
August 28, 2023
You may also be interested in…